
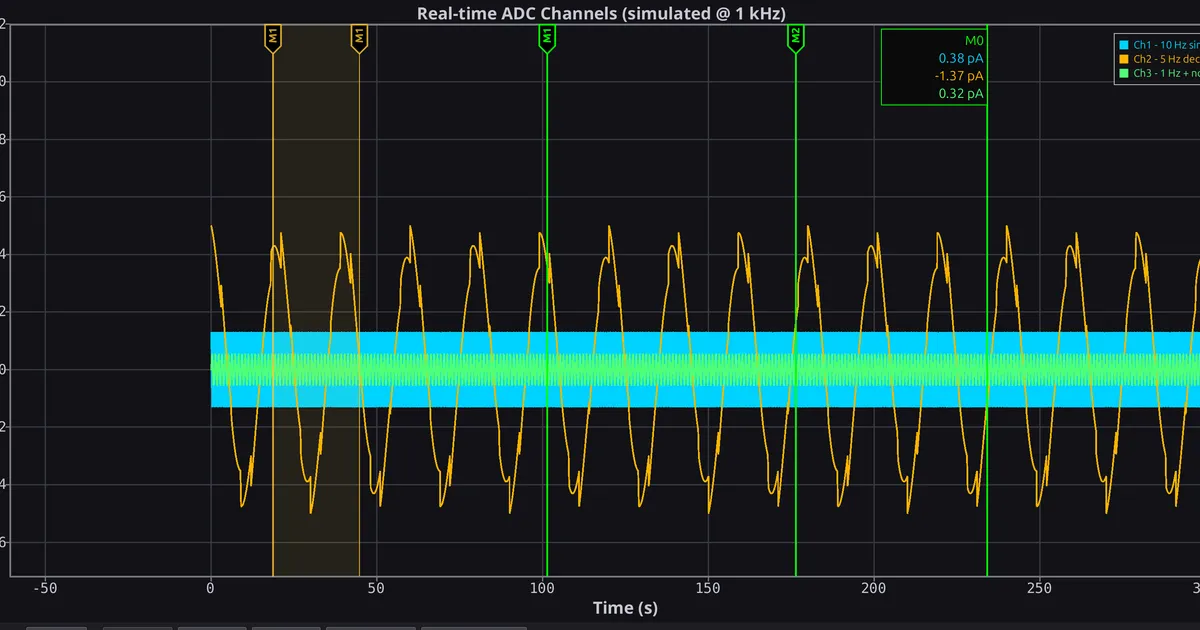
The problem! Too many data on the screen!
As a maker and robotic enthusiast I usually face the same problem: receiving and plotting data from several sensors/actuators. For slow data streams (up to hundreds of Hz) like GPS, Light sensor or flow meter among others, common libraries like Matplotlib for Python, or PyQtGraph for Qt are enough. They can handle hundreds, even few thousands, of updating points seamlessly.
However, when working on my microPowerMeter, which sends 4 kSps composed of two float values, the data on the screen increases rapidly, reaching hundreds of thousands of points in a few seconds. With the aforementioned libraries (Matplotlib or PyQtGraph), the performance drops very quickly when trying to keep up with the updating data.
Important
This project has already make its first steps and actually, you can find the published library in Github: QtRealTimePlot
Expect it to have the typical problems of a newborn project.
My goals
After struggling for years, I decided to build a a graph library that allows to plot and analyze a real-time updated data source on the fly, specifically built for high speed and high volume streams. This library aims to:
- Handle updating data at high rates.
- Interactive.
- Implemented in Qt with C++.
- High performance (no performance drop with millions of points)
- Data statistics calculation on the fly.
The design
Painter
When I thought about rendering a lot of points, while keeping the interface interactive, video games came to mind. They handle millions of points, with complex lighting and physics calculations, and still work at 60fps. While old libraries struggle to reach 30fps with thousands points.
They usually rely on graphics libraries that uses the GPU for the painting, while overkill for many applications we need the maximum
performance so I opted for the OpenGL approach. I started with simple OpenGL GL_LINE_STRIP but had to move onto VBO (Vertex Buffer Objects)
to increase performance, lets dive into this.
I started rendering the data with line strips and a basic shader (see code below). This approach forces me to prepare and send the whole array of points in every update, which failed with lots of data point. In this implementation all the hard work is done by the processor calculating the data points in the viewport and sending the pixel position for each line.
Note
You can check the shader and drawLineStrip in RealtimePlot_paint2.cpp at commit 29af4f9
The next approach is to use the GPU to handle some of the workload, updating the shader so it calculates the correct position of the pixel in the screen.
Bucketing: The performance king.
Pixels are not infinite, if you want to render 1M points on a screen of 2560 pixels wide, mathematically multiple samples will inevitable overlap on the same pixel. In fact there will be 1,000,000/2560 = 390 points fighting for a single pixel. If we render all the data samples there will be a lot of GPU calculations that will just render the same pixel.
To fix this problem and improve performance, the library groups the data points into a representative sample (a bucket) that contains the most important piece of information required to accurately render the graph without glitches. These representative samples shall contain at least the minimum and maximum value within the bucket.
The ‘bucketing’ processing can be made several times for coarser detail. That means that with 2 levels of bucketing a 1M point buffer with a reduction regulation of 100, the first bucketing only contains 10.000 samples while the second one only 100.
The library includes this bucketing approach with 2 levels, and it automatically detect the optimal detail level for the current zoom. Being able to render huge chunks of data without affecting performance.
Cursors
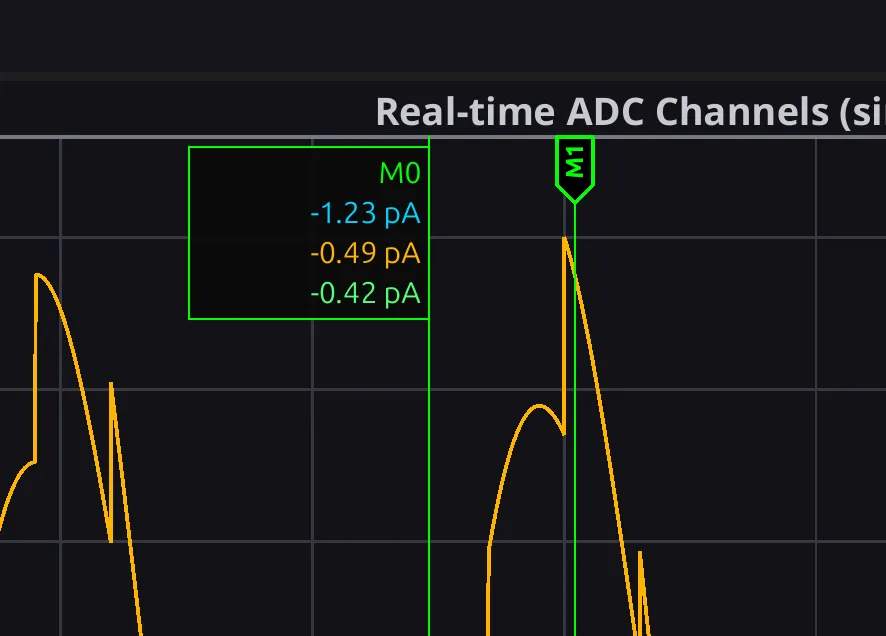
Another feature that I always miss, is a integrated cursor in the graphical library, so I integrated two kind of cursors: simple and ranged. The former is the cursor that marks a single position in the plot, while the latter is a cursor meant to measure some parameter withing a range.
The library provides the api to place, interact and get information about the signals at the cursor position. It also provides the interface to obtain basic statistics of the signal in the ranged cursor.
Single cursor
The single cursors can be either simple or full: One for just placing a mark on the plot, while the full
marker shows the data of all the series on that point.
The objective is to have an interface to obtain the information of the data on the cursors positions.
Ranged cursor
The ranged cursor is used to select a section of the data to extract or calculate some statistics from the actual data.